SharePoint 2010: Visualise Data, Chart Viewer Web Part VS Chart Web Part
In SharePoint 2010, there is a couple of ways to display data in visually appealing charts (that certainly all managers enjoy).
The difference between the Chart Viewer web part and the Chart web part lies in the scenarios they were build to be used at.
The Chart Viewer simply visualises data from a SharePoint list. That is it. SImple visualisation of SharePoint Data.
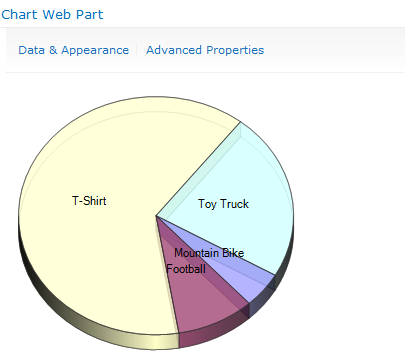
The Chart web part however, provides a wizard based interface through which, the user can connect it to more datasources, to create charts from the data stored there in.
Another option is to use Excel Services to achieve even better functionality, for example formulas and spreadsheets. However, Excel Services do not work against SharePoint data. One of the previous options will need be used for that scenario.
Powered by Zoundry Raven