 The developer dashboard is a new invaluable tool for the developer. It enables reading through the calls made at any time, so that the developer will know whether it is his/her own code slowing down the system or SharePoint itself. Items displayed in the developer dashboard include web part events, Windows Communication Foundation (WCF) calls, SQL queries and the call stack which includes the SPMonitoredScope. Also, note that the calls to the SQL are hyperlinked so that clicking on them will display the entire SQL command that is used, with the call stack that triggered the call and IO statistics. To turn the developer dashboard on, the developer will have to do it through either PowerShell commands or by stsadm commands. They both essentially use the same API calls. 1. Activating the Developer Dashboard through stsadm commands :
stsadm -o setproperty -pn developer-dashboard -pv ondemmand
In order to use the stsadm commands, you will need to kick start the SharePoint 2010 Management Shell, which is in fact the Windows PowerShell with the SharePoint extensions activated, and type the aforementioned command in there. The SharePoint 2010 Management Shell is located in the SharePoint folder in your Programs folder of your Start menu. Please do note that the single command that wou will execure, does in fact go through a number of steps before successfully completing and as such, it will take some time during which, your system may appear to have frozen. This is perfectly normal and is not to make the developer worry (specially when working on virtual machines). The following screenshots should help the beginner developer. 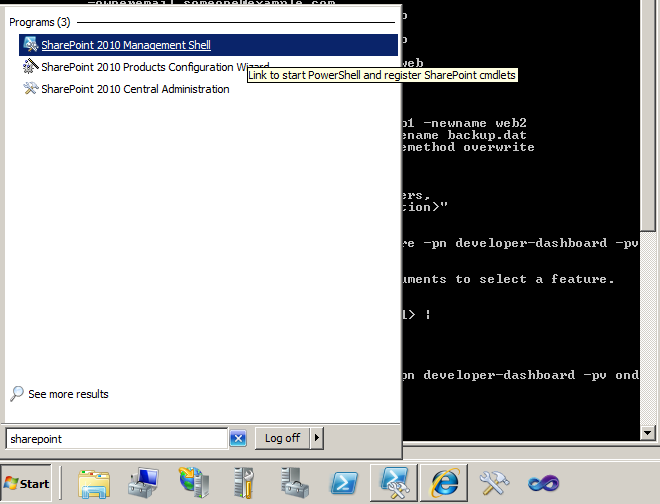
 2. Activating the Developer Dashboard through Visual Studio code (run in Central Administration through a Web Part):
SPWebService cs = SPWebService.ContentService; cs.DeveloperDashboardSettings.DisplayLevel = SPDeveloperDashboardLevel.On; cs.DeveloperDashboardSettings.Update();
edit: The developer dashboard will then be activated and will appear as an icon on the upper right hand corner of the Centra Administration web site. Do note that unless you deploy to the Central Administration, the web part will produce an error. This is normal as the Developer Dashboard is a farmwide feature and will produce a security exception. Also, do note that in order for the aforementioned code to run, you will need to provide a using statement to the Microsoft.SharePoint.Administration. The screenshot below displays the icon on the top right hand corner and the Developer Dashboard in the lower part of the screen. 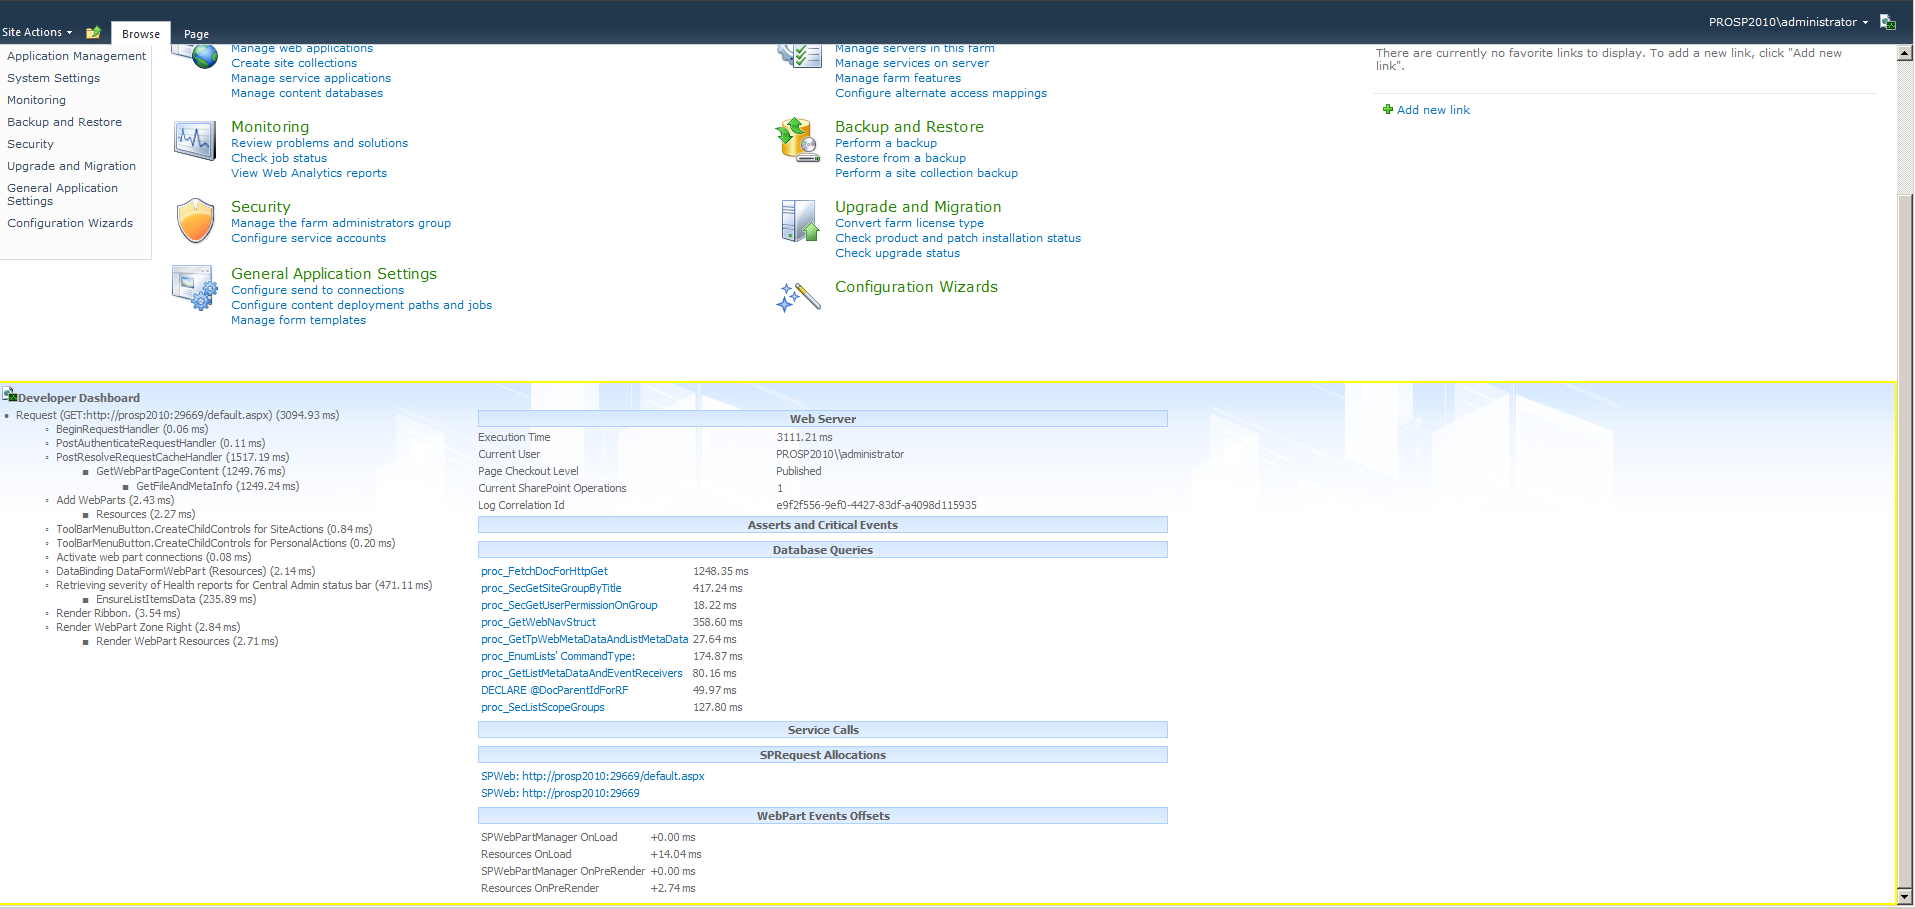 3. Activating the Developer Dashboard through PowerShell commands :
write-host write-host “Loading PowerShell environment for SharePoint” -foregroundcolor Green write-host # unload & load the sharepoint powershell snapin $snapin = Get-PSSnapin | where-object { $_.Name -eq ‘Microsoft.SharePoint.PowerShell’ } if ($snapin -ne $null){ write-host “Unloading SharePoint PowerShell Snapin…” -foregroundcolor Blue remove-pssnapin “Microsoft.SharePoint.PowerShell” write-host “SharePoint PowerShell Snapin unloaded.” -foregroundcolor Green } $snapin = Get-PSSnapin | where-object { $_.Name -eq ‘Microsoft.SharePoint.PowerShell’ } if ($snapin -eq $null){ write-host “Loading SharePoint PowerShell Snapin…” -foregroundcolor Blue add-pssnapin “Microsoft.SharePoint.PowerShell” write-host “SharePoint PowerShell Snapin loaded.” -foregroundcolor Green } write-host “Enabling the developer dashboard…” -foregroundcolor Blue $contentService = [Microsoft.SharePoint.Administration.SPWebService]::ContentService $dashboardSetting = $contentService.DeveloperDashboardSettings $dashboardSetting.DisplayLevel = [Microsoft.SharePoint.Administration.SPDeveloperDashboardLevel]::On $dashboardSetting.Update() write-host “Developer dashboard enabled.” -foregroundcolor Green
An important thing to keep in mind is that the Developer Dashboard will not -at least not by default- display information about the developer’s custom code. It will indeed track the calls that the custom code is making but it will not track the source code itself. To read more about debugging custom code with the Developer Dashboard, make the jump here.
Powered by Zoundry Raven


[…] already mentioned, the developer dashboard is an invaluable tool for the developer who wishes to display information […]
[…] already mentioned, the Developer Dashboard can be enabled or disabled by the developer, through one of three ways: […]
[…] 5. A new item for the developer’s toolbox is the Developer’s Dashboard. This allows the developer to examine what calls are being made and whether it is his/her own code slowing down the system or if it is SharePoint itself. The Developer’s Dashboard is default to off so the developer will need to enable it. However, the Developer Dashboard does not come in binary on/off. It also supports the “on demand” option which puts a icon in the upper right hand corner of the site that once pressed, enables the Developer Dashboard in the bottom section of the screen. There is a number of ways the developer can use to activate the Developer Dashboard and they can all be checked by making the jump here. […]