 As already mentioned, the developer dashboard is an invaluable tool for the developer who wishes to display information and debug SharePoint code. It is quite extensive too, as it displays information about all the aspects that a developer would wish to track, including SQL calls that are also linked to the entire command line (the one that ran when the call was made). Unfortunately, by default, the Developer Dashboard will not display extensive information about custom code, albeit calls made from within the custom code will be tracked. However, extensive tracking of custom code can be implemented.
The developer can include monitored sections of their custom code to the Developer Dashboard, by implemented the SPMonitoredScope. As best practice, the developer should always wrap any code that executes on SharePoint, within an SPMonitoredScope class. The SPMonitoredScope class is part of the Microsoft.SharePoint.Utilities namespace, so the respective “using” will have to be in place.
The SPMonitoredScope comes with two constructors. The first one, accepts one string that is the name of the new scope. The second one, accepts a string, that is the name of the new scope, an integer that is the maximum time in miliseconds for the execution of the monitored scope and an array of objects that implement the ISPScopedPerformanceMonitor interface. The funny thing is that the SPMonitorScope is said to be unavailable in sandboxed solutions but, according to MSDN, the ISPScopedPerformanceMonitor interface is available in sandboxed solutions (okay, why?). When the maximum time, the integer provided within the constructor, is passed, the frame around the Developer Dashboard turns red and the trace level for the code is increased.
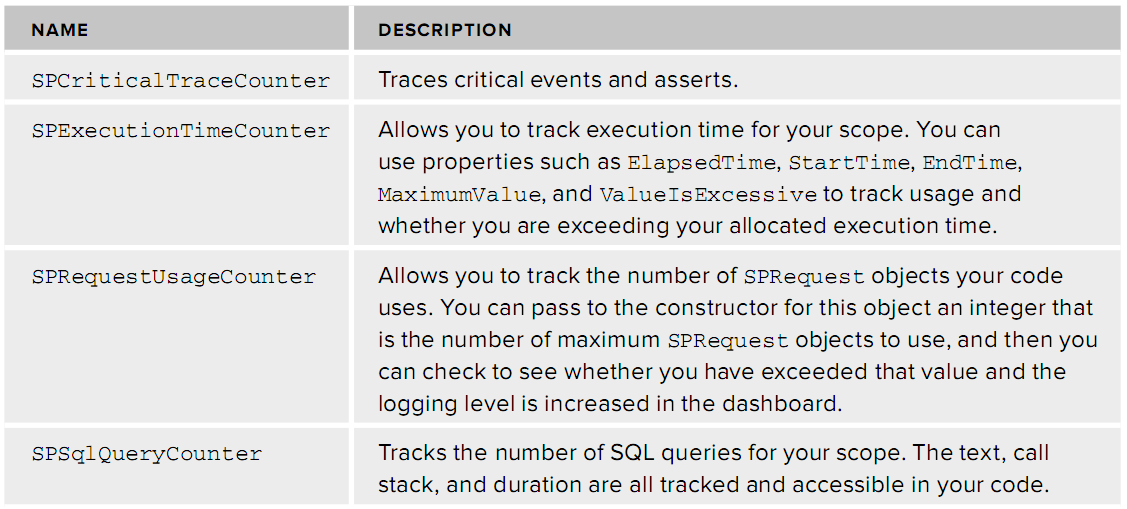
The following table, taken from the invaluable Professional SharePoint 2010 Development by Wrox, displays the classes that implement the ISPScopedPerformanceMonitor interface.
Powered by Zoundry Raven


[…] An important thing to keep in mind is that the Developer Dashboard will not -at least not by default- display information about the developer’s custom code. It will indeed track the calls that the custom code is making but it will not track the source code itself. To read more about debugging custom code with the Developer Dashboard, make the jump here. […]
[…] 5. A new item for the developer’s toolbox is the Developer’s Dashboard. This allows the developer to examine what calls are being made and whether it is his/her own code slowing down the system or if it is SharePoint itself. The Developer’s Dashboard is default to off so the developer will need to enable it. However, the Developer Dashboard does not come in binary on/off. It also supports the “on demand” option which puts a icon in the upper right hand corner of the site that once pressed, enables the Developer Dashboard in the bottom section of the screen. There is a number of ways the developer can use to activate the Developer Dashboard and they can all be checked by making the jump here. For more information about debugging custom code with the Developer Dashboard, make the jump here. […]